Data Log Viewer
Data log viewer settings are made in the Data Log Settings window.
- Infinitely adjustable data window size - just resize the window and the cells, plots and legends automatically adjust
- Ultra fast mouse follower - just touch the graphs and view the data immediately
- Statistical analysis of data - analyze the entire run, several analyses for each parameter (min, max, average, etc.)
- View acceleration simulation data directly from acceleration simulator
- Adjustable sampling rate for careful detail examination or longer-term trend recognition
- View multiple, simultaneous windows - all windows remain "live" regardless of input focus
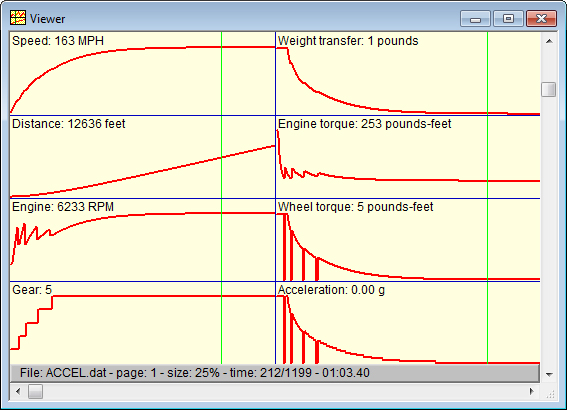
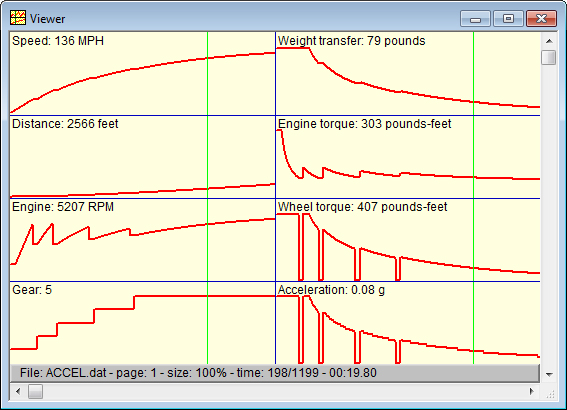
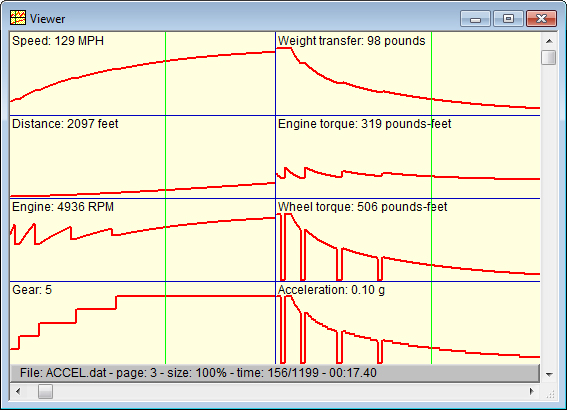
Here is an example data log viewer displaying acceleration information from the acceleration simulator.
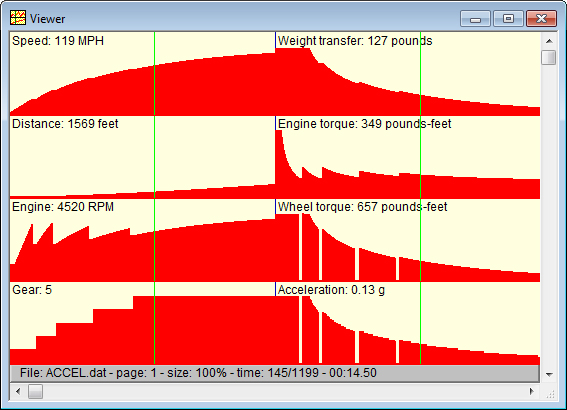
The data logger can also display in a filled mode if desired.
The horizontal scroll bar is used to pan the graphs from left to right.
The vertical scroll bar is used to adjust the time scale so you can choose between seeing more detail or seeing more elapased time. This adjustment works independently of the ability to set the window size as desired.