Strut Suspension Geometry Simulation
Vehicle travel and roll is simulated by dragging the image with the mouse, or with scroll bars.
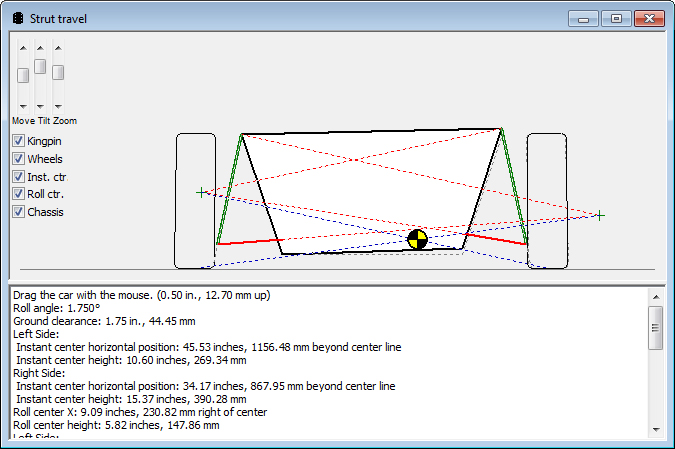
The chassis outline (blue lines) can be dragged up and down and rolled from side to side with the mouse (or moved with the scroll bars). You can watch the picture of the chassis move, and at the same time, the suspension movement, the wheel/tire movement, and the changing imaginary (dotted) lines that illustrate the instant centers (red dotted lines) and the roll center (white dotted lines). The numeric data in the list box below also changes in real-time as the car is moved through its various combinations of travel and roll angle. In cases where the imaginary lines extend far beyond the vehicle, you can zoom the picture in and out as required. Imaginary (gray dotted) lines also show the static position of the tires, the kingpin axis position, and the chassis. All imaginary lines can be turned on or off individually.
Along with the visual depiction are calculations for the following:
- Roll angle
- Ground clearance
- Instant center and roll center for each side
- Roll center horizontal and vertical position
- Kingpin angle and kingpin offset (scrub radius) for each side
- Camber angle for each side
- Track width
Calculated data instantly updates automatically as the car moves.
Imaginary (dotted) lines also indicate the tire's normal position, making it easy to visualize how much the tire has moved. All of the imaginary lines can be turned on and off individually.
Specifications are entered on the strut travel inputs pages and the travel input page.